Blog 4: Installing Anaconda

I have created this blog post on how to install Anaconda and the necessary packages required to perform Data Analysis and vizualization.
Anaconda
Anaconda is a free and open-source distribution of the Python and R programming laguages for scientific computing (data science, machine leaning applications, large-scale data processing, predicitve analysis, etc.). This open source distribution aims to provide simplified package management and deployment. The distribution includes data-science packages suitable for Windodws, Linux, and macOs. It is developed and maintained by Anaconda, Inc.
Difference between package installation with ‘pip’ and ‘conda’
Most of the time while installing anaconda packages I use ‘conda install
EG: google ‘Tensorflow’, can find that it stops working having used ‘pip’ to install a different package that requires a different version of the dependent numpy library than the one used by Tensorflow.
In the other hand, using ‘conda’ to install packages, it will analyse the current environment including everything currently installed, and any versions limitations specified. Since the user may wish to have both Tensorflow version 2.0 or higher and shows warning if this cannot be performed.
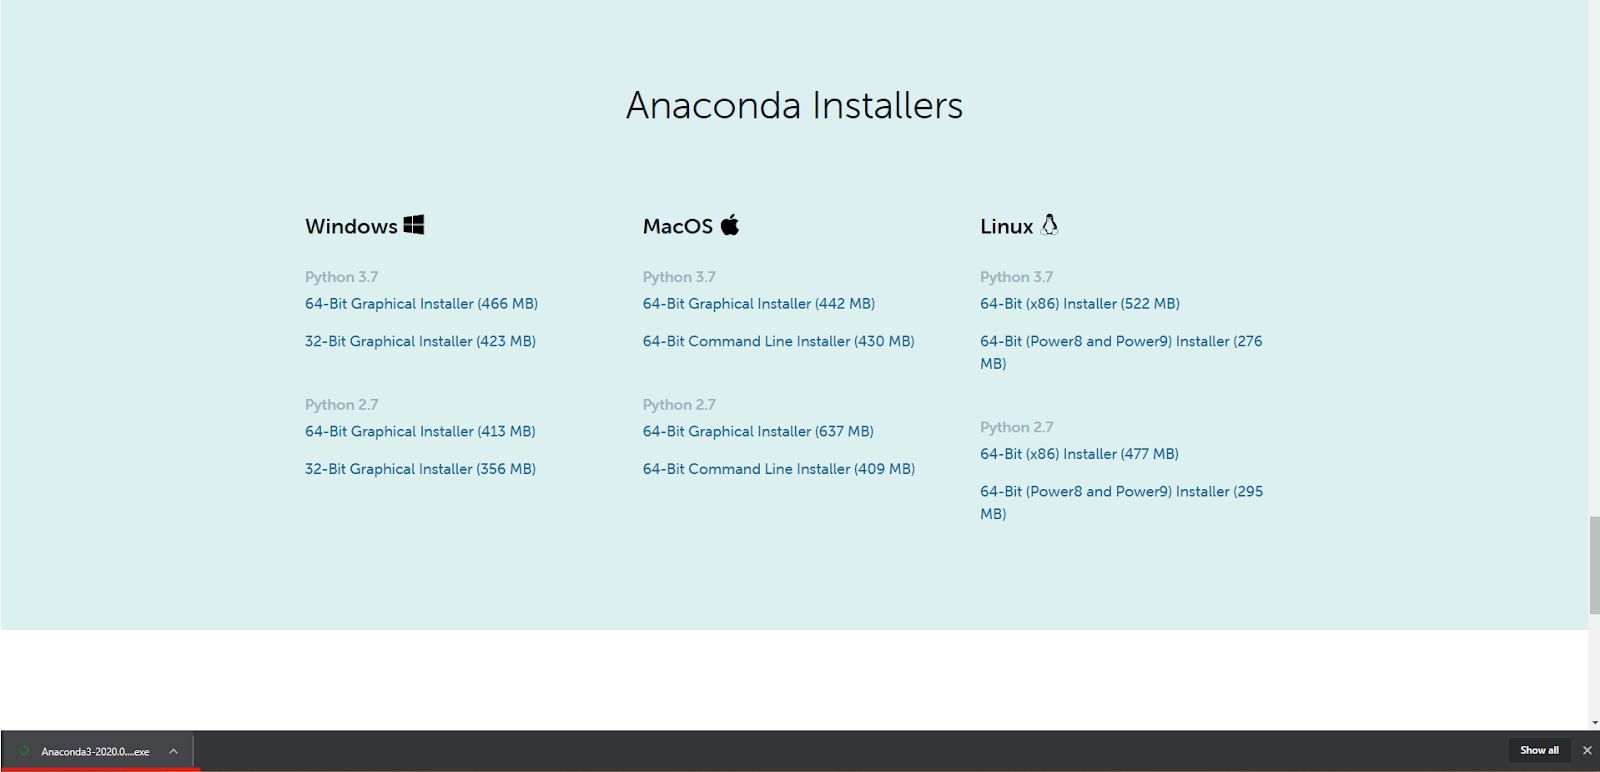
Installing Anaconda
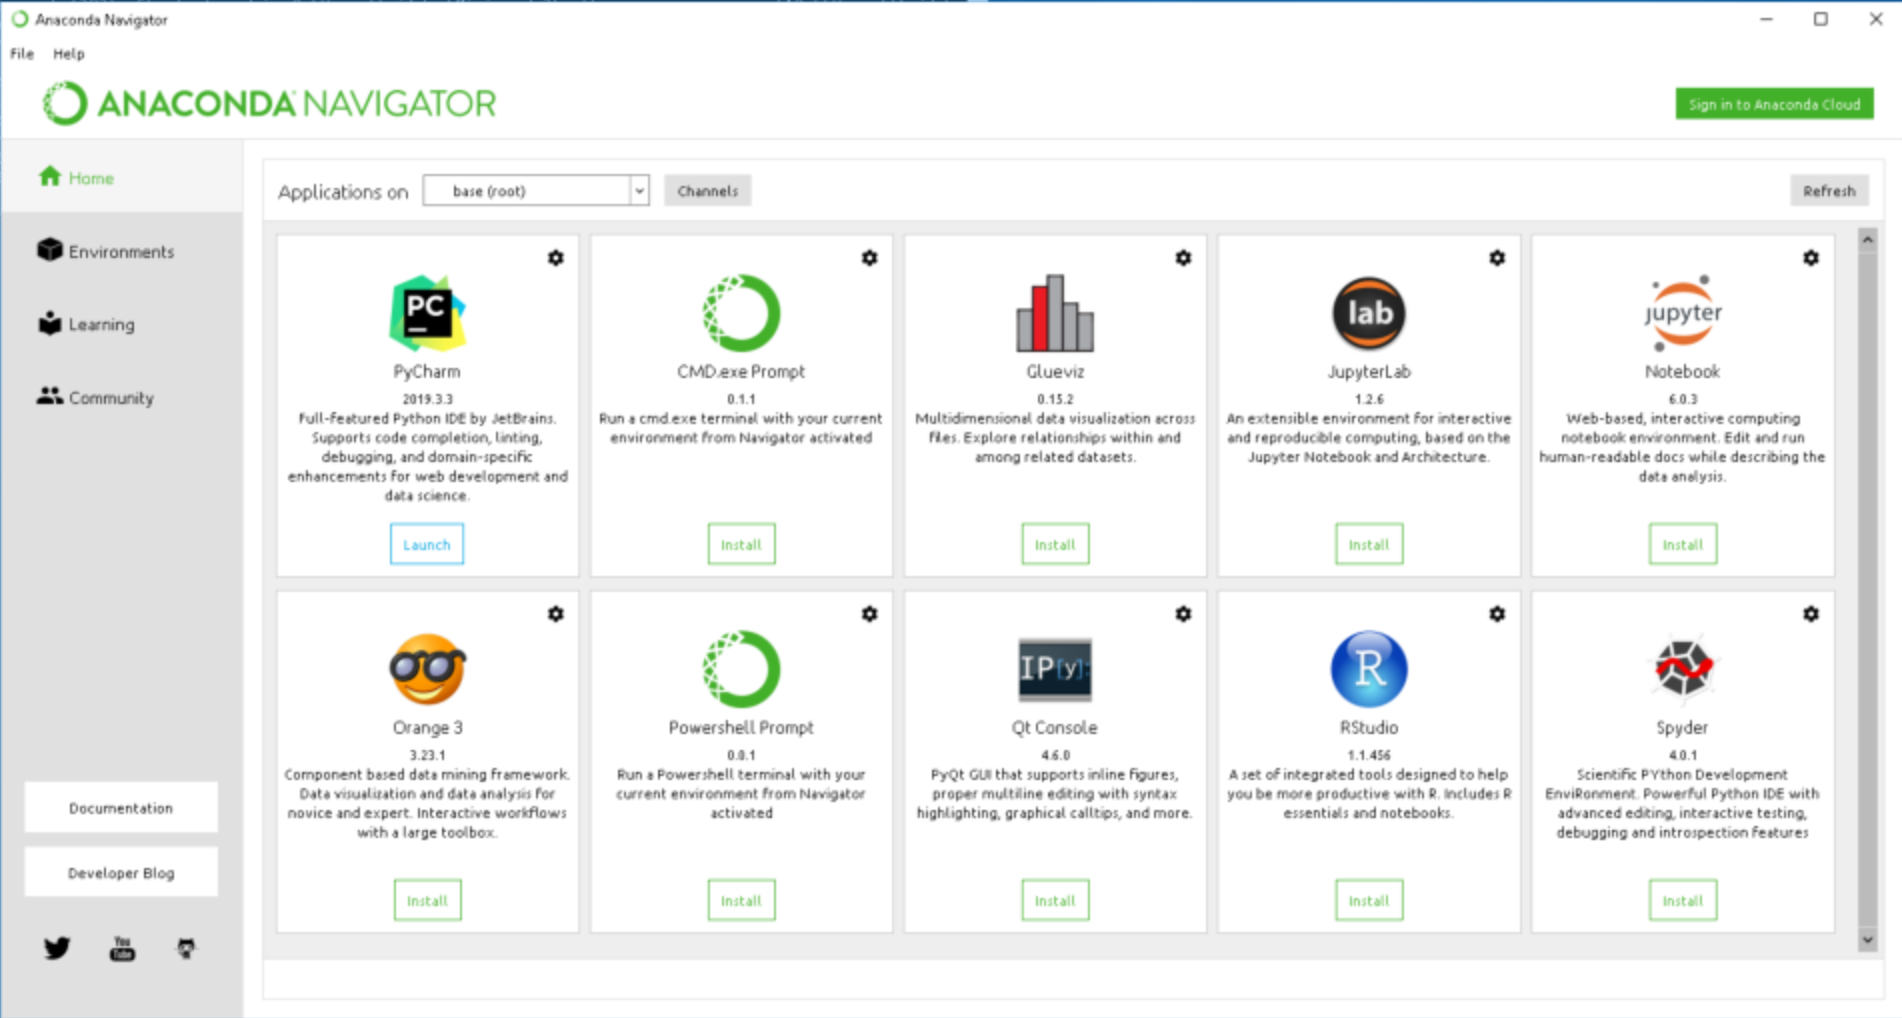
Anaconda Navigator
There are different applications on the base(root) which can be viewed using Anaconda Navigator:
Powershell Prompt, JupyterNotebook, RStudio, Glueviz, Spyder, etc.
We can further download new applications, packages and environment using Anconda Navigator or CONDA prompt. I prefer using ‘CONDA prompt’ to install packages
Jupyter Notebook and packages for data analysis
Jupyter Notebook is an open-source web application that allows you to create and share documents. I have been using this open-source web appliation for my project. There are different packages required to be installed using Anaconda Prompt to use in the Jupyter Notebook.
Some of the useful and most used packages are listed below:
- conda install -c anaconda numpy
- conda isntall pandas
- conda install -c conda-forge matplotlib
- conda install -c anaconda scikit-learn
- conda install -c anaconda graphviz
Example of using Jupyter Notebook
I will give a short brief on had a project on medium range data set to make analysis using different tools. The main objective of this project was make analysis of type of wine based on different features such as: fixed acidity, volatile acidity, critic acid, residual sugar, cholorides, etc.
import numpy as np
import pandas as pd
import matplotlib.pyplot as plt
Here, we will use pandas to extract the CSV file and create a new DataFrame
df_wine= pd.read_csv('../wine-labeled.csv')
df_wine.head(5)

	fixed acidity	volatile acidity	citric acid	residual sugar	chlorides	free sulfur dioxide	total sulfur dioxide	density	pH	sulphates	alcohol	quality	type
0	7.4		0.70			0.00		1.9	0.076	11.0		34.0	0.9978	3.51	0.56	9.4	5	red
1	7.8		0.88			0.00		2.6	0.098	25.0		67.0	0.9968	3.20	0.68	9.8	5	red
2	7.8		0.76			0.04		2.3	0.092	15.0		54.0	0.9970	3.26	0.65	9.8	5	red
3	11.2		0.28			0.56		1.9	0.075	17.0		60.0	0.9980	3.16	0.58	9.8	6	red
4	7.4		0.70			0.00		1.9	0.076	11.0		34.0	0.9978	3.51	0.56	9.4	5	red
Here, I have used Logistic Regression for the classification model to determine the accuracy score. By importing the sklearn model and metrics we can train our model to predict the test data sets.
# conver the X-data to a numpy array
# here we determine our X-value and target feature(y_val) which is 'wine type'

x_val= np.array(df_wine.loc[:,"fixed acidity":'alcohol'])
y_val=np.array(df_wine["type"])
Now, we will use our LogisticRegression model for predciting our model and output the Accuracy Score at the end to show how accurate our model is.
# PERFORM your FAVORITE CLASSIFICATION method (KNN or logistic Regression) on P
from sklearn.linear_model import LogisticRegression as LR
from sklearn.model_selection import train_test_split
from sklearn.metrics import accuracy_score
model=LR()
#SPLIT the data sets into TRAIN and TEST

xtrain, xtest, ytrain, ytest= train_test_split(P, y_val, test_size=0.25)

# create model to fit train data sets
model.fit(xtrain, ytrain)
ypredict=model.predict(xtest)

# get the accuracy score
accuracy_score(ytest, ypredict)
0.92
Here, the accuracy is ‘0.92’ or 92%. It means our model using Logistic Regression classification we were able to predict the test data sets with 92% accuracy.